A Notion Gantt Chart brings clarity to complex projects by visualizing tasks on a timeline. Whether you’re a product manager planning sprints or a content creator mapping out a campaign, embedding a Gantt Chart in your workspace helps everyone stay aligned. In this guide, you’ll learn to set up your first Notion Gantt Chart, mimic dependencies, style your board, automate updates, and share it as a live roadmap.
Throughout this post, we will guide you step-by-step, ensuring you can confidently build and maintain project roadmaps without leaving Notion.
Understanding the Notion Gantt Chart Timeline View
What Is Timeline View?
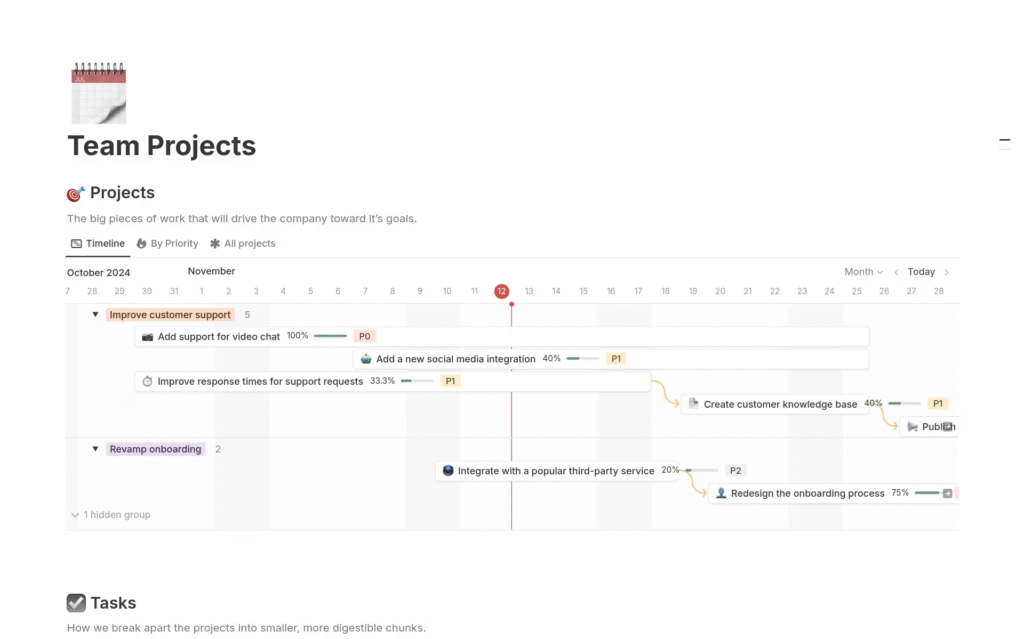
Notion’s Timeline View is the backbone of any Gantt Chart. Instead of a static table, Timeline View renders database items as horizontal bars along a date axis. Each bar represents one task or milestone, giving you an immediate visual of start and end dates.
When to Use a Notion Gantt Chart
- Long-term Roadmaps: Plan quarterly goals.
- Multi-phase Projects: See overlaps and handoffs at a glance.
- Stakeholder Updates: Embed a live Notion Gantt Chart in shared pages for real-time status.
Read More: How to Use Notion Colors Tool – Step by Step Guide
Setting Up Your First Notion Gantt Chart Roadmap
Create a Roadmap Database
- New Page → Add a Table database.
- Rename columns:
- Task Name (Title)
- Start Date (Date)
- End Date (Date)
- Status (Select)
- Owner (Person)
Switch to Timeline View
- Click Add a View → Select Timeline.
- Configure:
- Timeline By: “Start Date” to “End Date.”
- Set Group By to “Owner” or “Status” for colored lanes.
Populate Your Roadmap
- Click + New to add tasks.
- Assign Start & End dates.
- Choose Status (e.g., “Not Started,” “In Progress,” “Complete”).
- Optionally, use emojis or colored tags to highlight key milestones on your Gantt Chart.
Building Advanced Notion Gantt Chart Features
Mimicking Dependencies
- Add a Relation property called Depends On linking back to the same database.
- Use a Rollup to show the parent task’s end date.
- Manual visual cue: prefix dependent tasks with “↳” in the title.
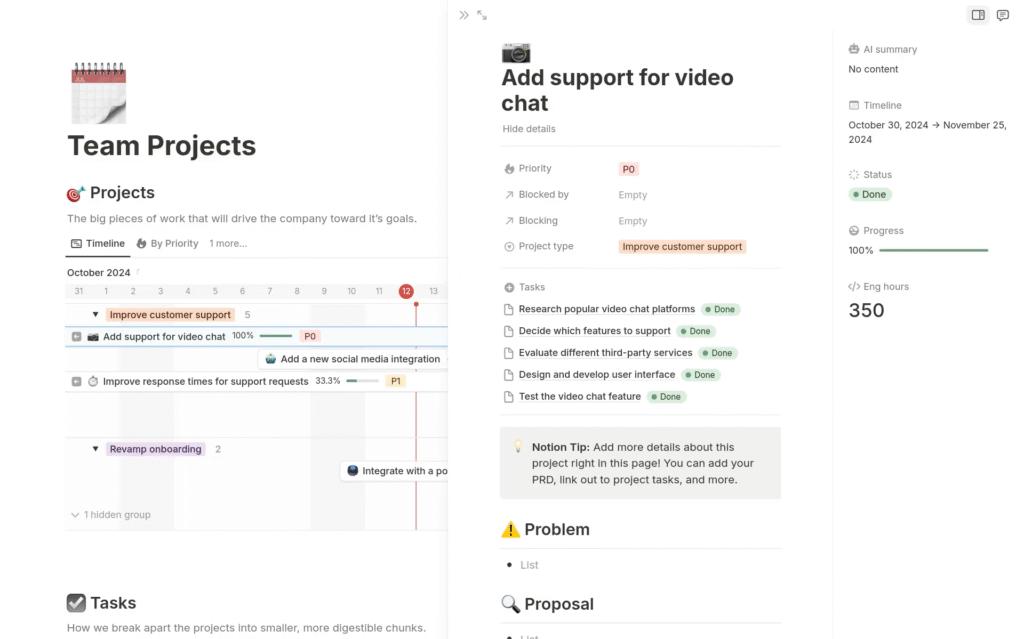
Displaying Progress Bars
- Create a Number property named Progress %.
- Add a Formula property: notionCopyEdit
prop("Progress %") + "%" - In Timeline View, enable Show Bar and select Progress % to overlay completion.
Grouping & Filtering
- Group By: Switch between “Owner,” “Status,” or custom tags.
- Filters:
- Show only High Priority tasks.
- View items due This Month or Next Quarter on your Gantt Chart.
Styling & Layout Tricks for Notion Gantt Chart Dashboards
Six-Column Layouts
- Use six Callout blocks side by side for KPIs alongside your Gantt Chart.
- Zoom out (⌘–) to fit columns; increase padding for readability.
Gallery Cards with Bigger Text
- In a linked Gallery view of your roadmap, set Title as the key property.
- Bold important words: Notion Gantt Chart Overview.
Light Mode vs. Dark Mode
- Light Mode: Use pastel tags.
- Dark Mode: Bright neon emojis stand out on your Gantt Chart.
Templates & Reusability for Notion Gantt Chart
Creating a Roadmap Template
- In your database, click New Template.
- Pre-populate with common phases:
- Research
- Design
- Development
- QA
- Save—every new Notion Chart page starts with these.
Publishing & Sharing Templates
- Enable Allow duplicate as template under Share.
- Share URL in communities like Notion Market or Reddit.
Automating Your Notion Gantt Chart Workflows
Integrating with Make (Integromat)
- Trigger: New Database Item → Action: Send Slack Message on milestone completion in your Notion Gantt Chart.
Notion API & Zapier
- Zap example: Google Calendar → Create Notion Timeline Entry
- Auto-backup: Notion Database → Google Sheets every 24 hours.
Recurring Task Automations
- Use a Template Button named “Add Weekly Sync” that inserts a new row dated one week out on your Notion Gantt Chart.
Embedding Your Gantt Chart in Websites & Dashboards
Public Sharing & Embeds
- Click Share to Web → toggle Allow duplicate.
- Copy the iFrame snippet and paste into your site.
Custom Domains & Branding
- Tools: Super.so, Simple.ink, or Fruition.
- Add custom CSS to match your brand—ensure your Notion Gantt colors align with site design.
Best Practices & Common Pitfalls for Notion Gantt Chart
- Keep date ranges realistic: Avoid bars spanning multiple quarters unless necessary.
- Limit visible tasks: Over-cluttered Gantt Chart views harm clarity.
- Archive completed items: Move them to an “Archive” database monthly.
- Regular backups: Export CSV quarterly to safeguard your roadmap data.
FAQs
- Can I export my Notion Gantt Chart to PDF?
- Yes—use Print > Save as PDF from the Timeline view.
- What’s the limit on items in a Notion Gantt Chart?
- Performance slows around 500 items; consider splitting large projects.
- How do I add dependencies in Notion Gantt Chart?
- Use Relation + Rollup properties to visualize linked tasks.
- Is there a mobile-friendly view for Notion Gantt Chart?
- Mobile supports Timeline but switches to List for narrow screens.
- Can I auto-calculate end dates in Notion Gantt Chart?
- Use a Formula like
dateAdd(prop("Start Date"), prop("Duration"), "days").
- Use a Formula like
Conclusion & Next Steps
You’ve now mastered how to build, style, automate, and share a Notion Gantt Chart as your golden roadmap. Start by creating your first database, then layer on dependencies, progress bars, and automations. Finally, publish or embed for stakeholders to see real-time updates.
👉 Next Steps:
- Download our free Gantt Chart template bundle.
- Subscribe for advanced tutorials on Notion formulas and API integrations.
Go ahead—bring your projects to life with a dynamic Notion Gantt Chart today!
To see more blog visit: Colors Convert